Business intelligence and counterparty risk assessment platform
One application combining registry data, financial statements and paid APIs into a coherent picture of a counterparty.
- 5
- data sources in one card
- 6
- architecture layers
- 24h
- data refresh cycle
- STATUS
- Production system, developed iteratively
- ROLE
- Architecture, integrations, production deployment, maintenance
- AREA
- Business applications · Data integrations · Risk management
Assessing the credibility of a counterparty used to require manually checking several public registers, downloading financial statements and copying information into a spreadsheet. I built an internal platform that collects data from several sources, parses official financial statements, calculates indicators and presents them as a single counterparty card, together with change history, relationships and a PDF report. The system is used by several dozen users across purchasing, finance, sales and the management board.
- 01The court register, tax status, the statement repository and sanction lists operated as separate sources.
- 02Official financial statements came as structured XML conforming to changing schemas.
- 03The result of an analysis often stayed in a local spreadsheet instead of a systemic decision trail.
- 04The paid API generated cost with every query, so usage control and caching were needed.
- 05The lack of change monitoring meant a significant change at a counterparty could only be noticed at the next manual analysis.
A single web application available on the company network. The user searches for an entity by registry data or name and gets a consistent view.
- 01Counterparty card 360: registry data, tax status, representation, ownership structure, financial data and source documents.
- 02Indicators and trends: profitability, liquidity, debt and year-over-year dynamics, among others, calculated from structured data.
- 03Relationship graph: personal and capital relations between entities, helping to identify connections that require further verification.
- 04Entity comparison: several companies side by side on a common set of indicators.
- 05Watchlist and alerts: monitoring of observed entities and register changes.
- 06PDF report: ready material for further analysis or a decision.
- 07Administration panel: parameters, source diagnostics and cost control for paid API queries.
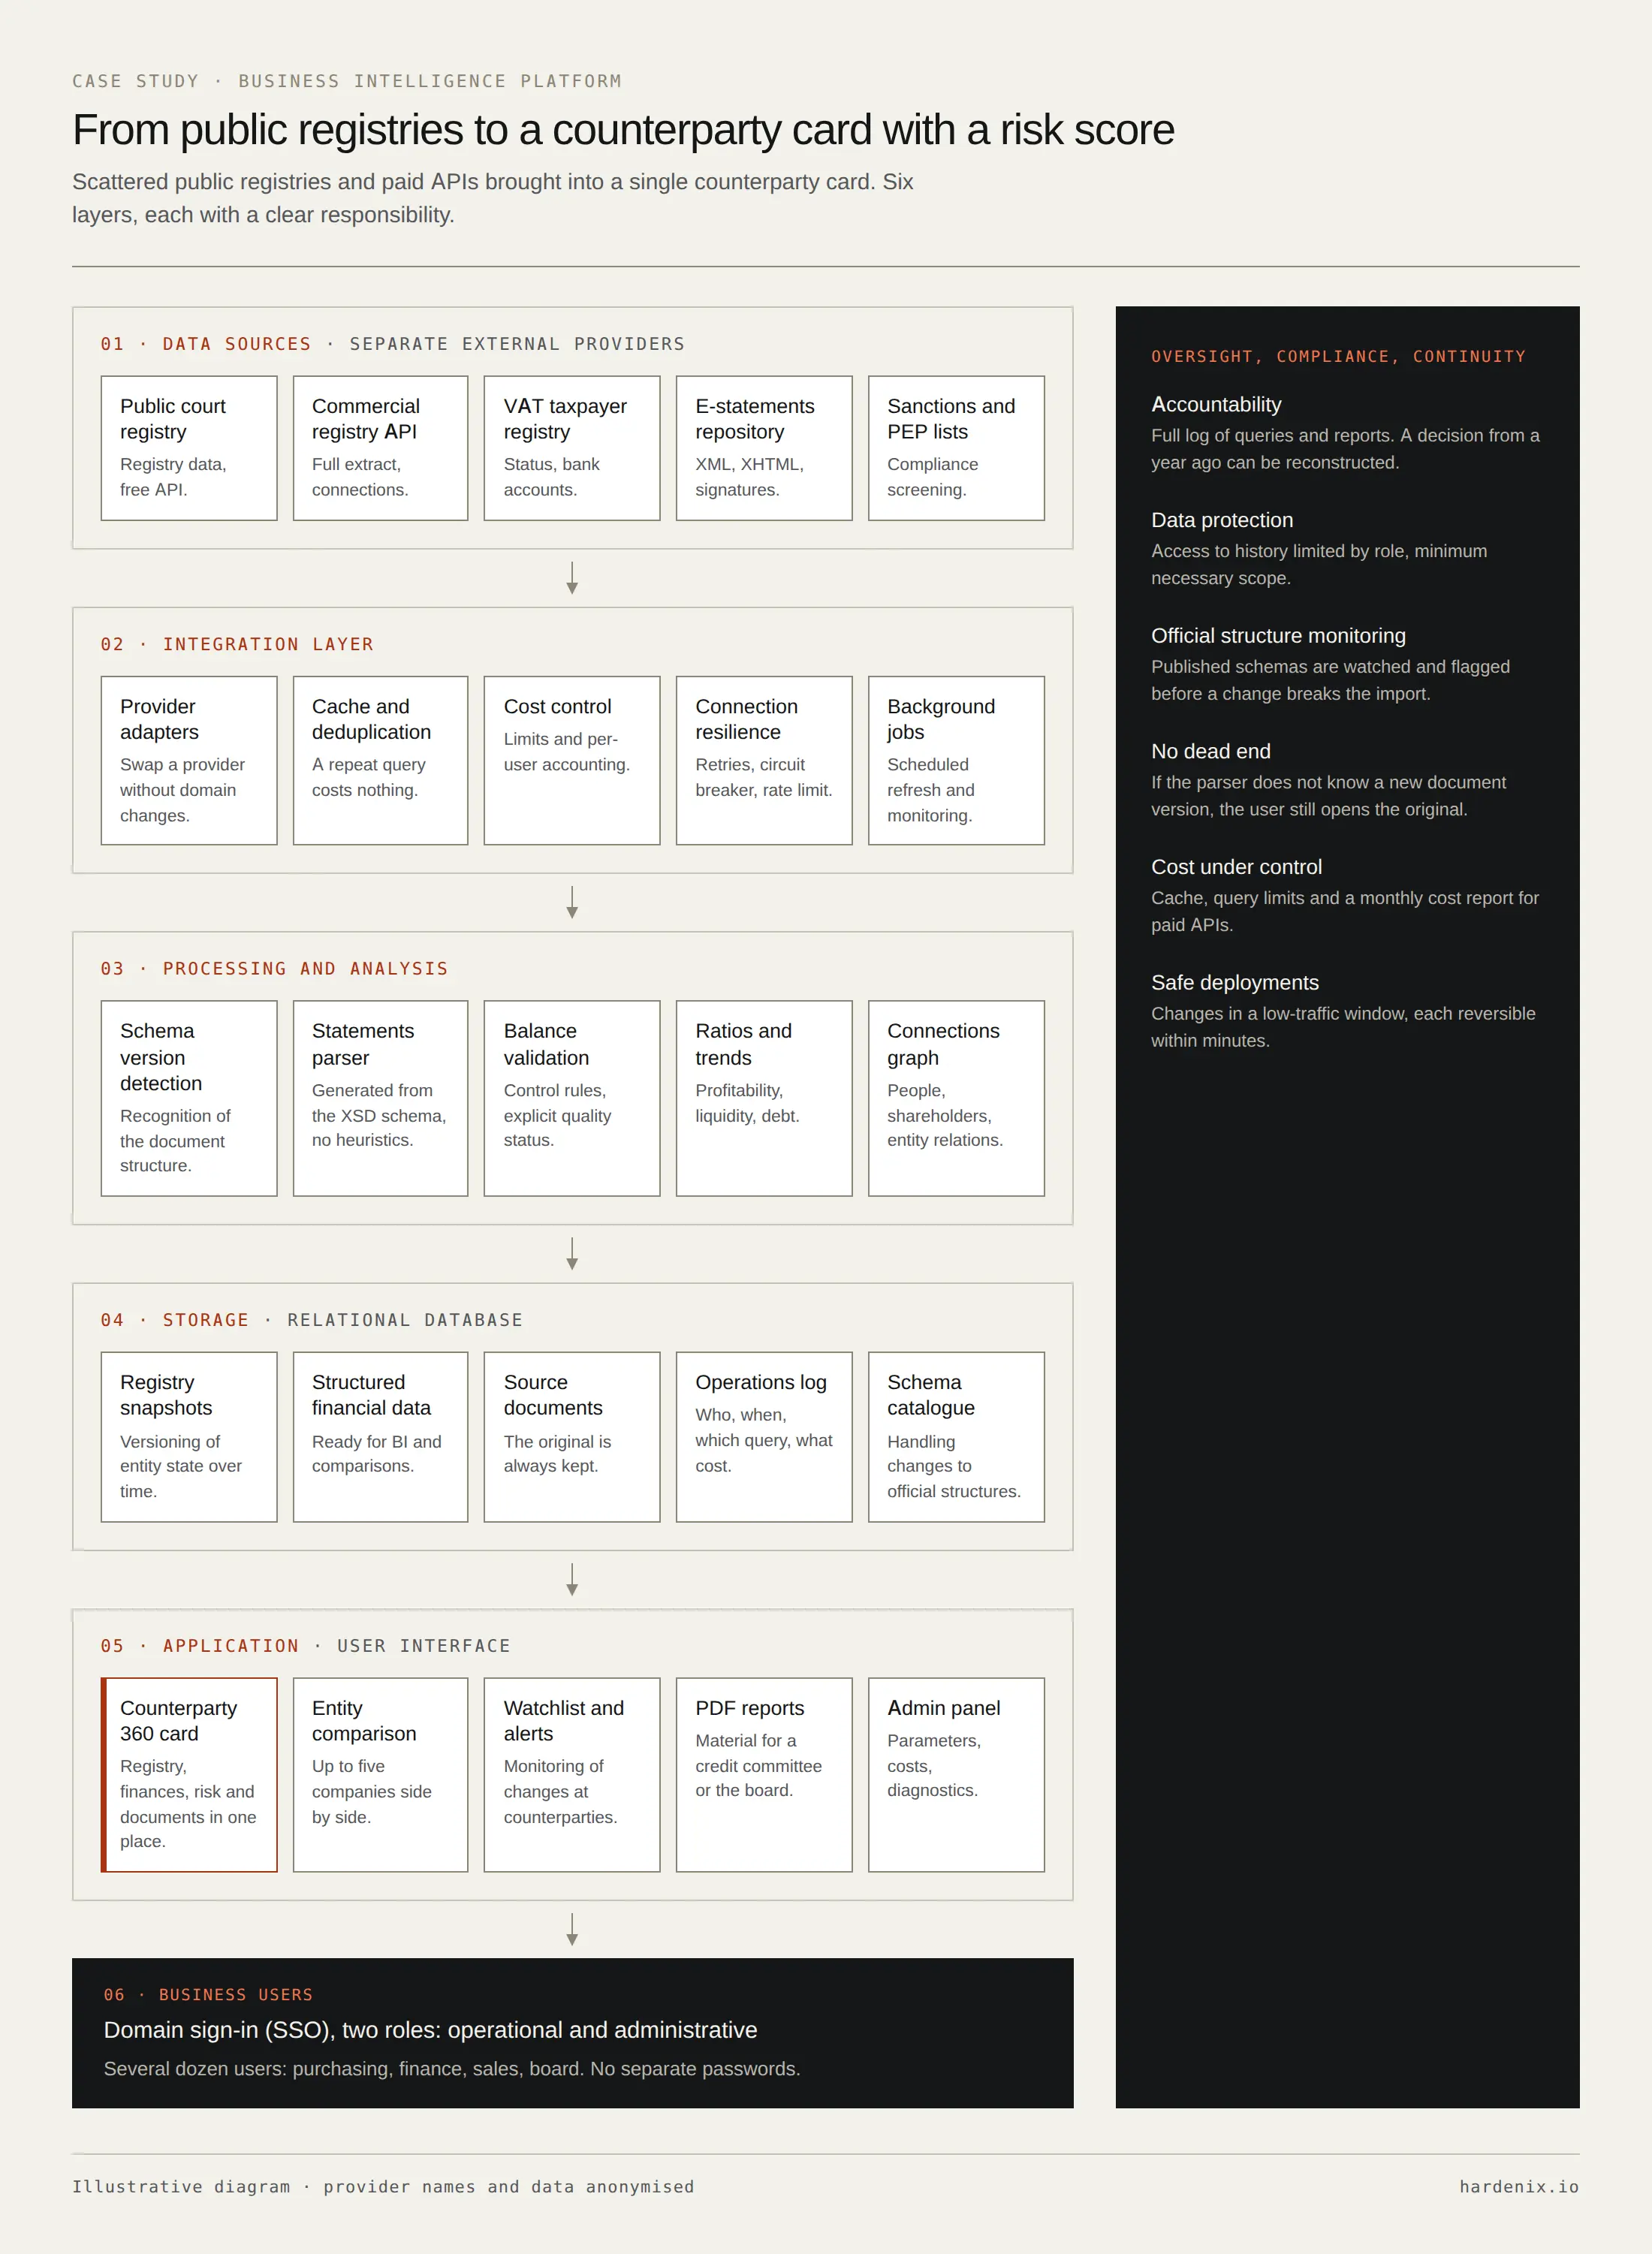
Six layers with separated responsibilities.
- 01Data sources: public and commercial APIs, the taxpayer register, the statement repository, sanction lists.
- 02Integration: an adapter per provider, cache, deduplication, cost control, retries, a circuit breaker and limits.
- 03Processing: schema version detection, an XSD-based parser, balance-sheet validation, indicators and the relationship graph.
- 04Storage: versioned snapshots, financial data in a structure ready for further analysis, source documents and an operations log.
- 05Application: the user interface, comparisons, the watchlist and reporting.
- 06Users: access integrated with the company directory and a separation of operational and administrative roles.
- 01A schema-driven parser instead of heuristics. Moving to models generated from XSD schemas made an unknown format an explicit error instead of silently missing data.
- 02Missing data must be visible. A financial record keeps information about its origin and read quality. A missing value must not look like a zero.
- 03No dead ends. Even if a new document version is not yet fully supported by the parser, the user can still open the source document.
- 04Monitoring of official structure changes. A background process checks for newly published structures and signals a change before it affects the import.
- 05Permissions from the company directory. Access and roles come from the corporate directory instead of a separate account model in the application.
- 06API cost as an observable parameter. Queries to paid sources are accountable, and caching limits repetitions.
- 01Counterparty analysis happens in one tool instead of several independent sources and a spreadsheet.
- 02A suite of automated tests protects the financial logic and permissions against silent regression.
- 03Every query and generated report leaves a trail that allows the basis of an earlier analysis to be reconstructed.
- 04Caching and limits reduce unnecessary costs of paid data sources.
- 05Financial data is stored structurally and can feed BI reporting without manual re-entry.
.NET · SQL Server · API integrations · XML/XSD · on-premise
Anonymized material. The organization name, data providers and details of the production environment have been omitted. The diagram is illustrative.